
Register to stay up to date with Acoustic Imaging
Frequently Asked Questions:
Client has specified delivery of backscatter data. What should I expect to provide?
Delivery of backscatter data should be considered in two forms: raw and processed or rendered.
The raw backscatter data is initially captured in the format supported by the acquisition software (e.g., .ALL for Kongsberg SIS, .DB for QINSy, .S7K for Reson). This may be acceptable to the client but more than likely they will want a non-proprietary format that can be read by a number of processing / QC software packages. The Triton Imaging .XTF format is one option but for Beam Time Series (Snippet) type backscatter some software may have problems reading the packet containing the information (the XTF format is well-defined for capturing sidescan sonar type backscatter but not Beam Amplitude or Beam Time Series).
Perhaps the most appropriate non-proprietary format is the Generic Sonar Format maintained by the Lamont Doherty Earth Observatory:
https://www.ldeo.columbia.edu/res/pi/MB-System/formatdoc/gsf_spec.pdf
The GSF format offers the advantage of capturing both geospatially-corrected bathymetry data (XYZ solution for each beam) and Beam Amplitude / Beam Time Series backscatter data. In addition, editing flags for the bathymetry data exist such that only those soundings (and associated Beam Times Series packets) with an Accepted flag are used in the rendered backscatter product.
The processed or rendered form of backscatter data is generally a geospatially-corrected mosaic assembled from all of the individual lines. Clarification should be made with the client as to the desired colour palette applied (e.g., gray scale or some other palette; acoustic shadows shown as dark or light shades) and pixel size. The mosaic may be delivered as either a GeoTiff or as an image file with associated text file containing coordinate information (e.g., TIFF plus TFW or JPG plus JGW).
How does the ArcGIS link work with Fledermaus?
Fledermaus – ArcGIS Link (FMGIS)
The ArcGIS linkage is available to any user with the 32-bit version of Fledermaus and an active ArcGIS license. If you are a 64-bit Fledermaus user you can still take advantage of the link by installing both versions of the software on the same PC. You can do your memory intensive processing using the 64-bit version and then save your Scene. Scene files work with both versions of the software, so open the Scene in the 32-bit Fledermaus to take advantage of the additional benefits that the ArcGIS link provides.
To use the ArcGIS linkage within Fledermaus you’ll first need to create an Arc Workspace data object within your Scene. An Arc Workspace data object can be created via the Create > Add ArcGIS Workspace option in the main menu. The Arc Workspace data object can then be used to either connect to an existing Arc Workspace (Folder, File, Personal, SDE) or create an entirely new Arc Workspace. The File type workspace is most popular as this links into a Geodatabase.
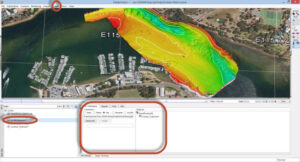
Once you have connected to an Arc Workspace you have the option to transfer files to ArcGIS from any Fledermaus data object or load feature classes/rasters/etc from ArcGIS to a Fledermaus Scene (thus creating different data objects within that Scene).
If conducting a bathymetry data editing/validation operation with either a QINSy Navigation Surface data object or Pure File Magic (PFM) data object a Transfer Wizard is available to shift a variety of common export products to the nominated Arc Workspace. These products include plotted soundings, feature soundings, the survey bounds, a BAG file, a bathymetry raster, and a sun-shaded geotiff image. Alternatively, point, line, polygon or image files may be directly loaded from ArcGIS into your Fledermaus to assist in the editing/validation exercise.
For more information regarding the Fledermaus to ArcGIS link (FMGIS add-on) please contact: sales@acousticimaging.com
What does 'truly integrated' mean?
Could ‘truly integrated’ be possibly the echosounder marketing buzz word of 2016?
But what does it mean?
That’s a great question and one should be directed back at the person who made the statement.
Does ‘truly integrated’ mean physical ‘proximity’ so that the GNSS Inertial system and the echosounder have been housed in a single box such that their components sit beside each other? So perhaps ‘physically proximal’ rather than ‘truly integrated’ would be more apt?
To ‘truly integrate’ a GNSS Inertial system one need consider the requirement to solve the set of inverse equations for position and orienation prior to solving the set of equations for the echosounder. Now because the GNSS antennas make range and angle measurements and the IMU makes acdceleration and veloity measurements but of these are required to be integrated. Thus the requirement for correct and successful resolution of all range, angle, acceleration and velocity measurement is required before the set of equations for solving the range and angle measurements from the echosounder. So, a system is housed in a single box does not change the requirement to solve each set of equations succesfully. It looks nice, but consider the additional weight on the end of a pole for a small vessel installation, or consider checking it onto an airline in a single box. It will be overweight and is something to consider if seeking portability. better to have 2 x 15kg cases than 1 x 30kg.
What is QZSS? Why should Australia care about QZSS?
QZSS is short for ‘Quasi-Zenith Satellite System’.
Answered by our Marine Programs Manager, Geophysicist Nicole Bergersen:
The first of 7 planned satellites for the QZSS was sent into orbit by Japan in 2011.
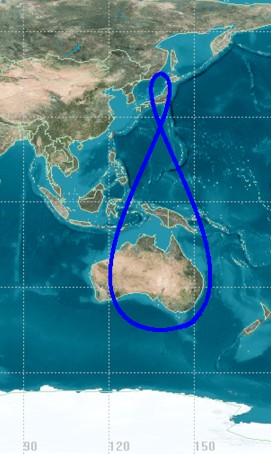
Unlike the GPS and Glonass constellations which are in orbit with a fixed angle between each satellite; QZSS uses both orbiting and geostationary satellites to create a quasi-zenith pattern such that the satellites are visible over Japan most of the time. This pattern has obvious benefits for Australia which forms an important role in the QZ, providing a tracking station located in Canberra. Other tracking stations are spread across Japan, Bangkok, India, Hawaii and Guam.
QZSS does not operate as a standalone constellation but uses GNSS to provide corrections for improved QZSS positioning.
What is Sub-Bottom Profiling? Is it Seismic?
Answered by our Manager of Geophysical Services, Dr Douglas Bergersen:
“Many folks lump seismic and subbottom profiling systems together but I prefer to make a simple distinction between the two techniques. When discussing seismic systems I view these instruments as having separate source and receiver units. Typical sources include sparkers, boomers, airguns, and waterguns, whereas typical receivers are single and multi-channel streamers. Subbottom profilers on the other hand have both the source and receiver in a single mechanical unit. Typical subbottom profilers include the Innomar SES-2000, Edgetech chirp system, and a variety of other linear systems.
Subbottom profilers generally provide a very high resolution view of the upper few meters of sediment. In essence, they provide an acoustic slice through the seabed. Reflectors within the subsurface provide information on sediment deposition and erosion, and when linked with a sampling program (e.g., coring, geotechnical logging, etc.) can extend those “point source” results across a large region. A good rule-of-thumb is that a subbottom profiler survey should be run in advance of any geotechnical sampling program to better define where the sampling program should be focussed.
Subbottom profile surveys have been used in support of engineering and dredging programs, and more recently for a variety of environmental studies.
For more information on what systems are available in Australia and how the technology might benefit your project, contact: info@acousticimaging.com“.
What types of backscatter data exist from a multibeam echosounder system?
With multibeam echosounder (MBES) systems the data logged for each beam footprint can be viewed as a small time series of intensity values. The bottom detection algorithm associated with the MBES provides a Range/Theta couplet that can be used to derive the depth for the footprint, and the time series of intensity values can provide two types of backscatter data.
BEAM INTENSITY: This type of backscatter information represents a single intensity value for each beam footprint, generally co-located with the depth value. The single intensity value may be a mean or median value for the entire beam footprint or within a certain dB range of the picked bottom sample.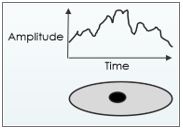
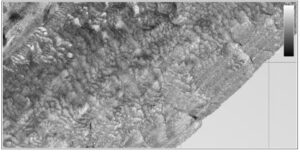
BEAM TIME SERIES (SNIPPET): This type of backscatter information represents multiple intensity samples across each beam footprint. As such, the resolution of the imagery is better than Beam Intensity backscatter.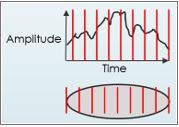
In addition to the intensity values associated with each beam footprint, some MBES systems can provide a Continuous Time Series of intensity values (or SIDESCAN type backscatter) from ping initiation to maximum swath range. These records can be created either by reserving a couple of staves on the receive array to continuously log the returns from the seabed or by reconstructing a continuous time series of returns from the Beam Time Series packets (e.g., TruePix from R2Sonic, although TruePix offers angle-of-arrival information not available from standard sidescan sonar systems).